What Is Google Data Studio?
Google Data Studio is an excellent, free data visualization tool that helps you create and build interactive dashboards, and customized, beautiful reports. It is the improved and better version of the good old Google Analytics. Using Google Data Studio, you will be saving many hours you would spend on understanding the confusing analytics data and making some sense of what’s been going on.
This article will help you understand the benefits of using Data Studio and explain some of Google Data Studio’s great features.

Benefits of Google Data Studio
Google Data Studio is created professionally by Google with many advantages and benefits as a data visualization tool. You can quickly get started even if you have never used a data visualization tool before. Here are some of our favorites:
Learn with Google Data Studio Tutorials: Google knows that no one comes to their platform as an expert. That’s why they are offering free tutorials that will make your life easier. Tutorials include videos that teach reporting, data source, and customization. You can Access the tutorial field by visiting the help section of the platform.
Get Dynamic Reporting: You can let Google Data Studio get data from the data sources and import them into your report in real-time. This benefit helps you stay up to date while editing your report.
Create Reports for Everyone: Google Data Studio can fit your company needs efficiently. The platform is extremely flexible and can help you create unique reports that have your company’s characteristics.
You can easily change the way your reports look by changing the colors, font sizes, themes and make your reports unique and easy to read.
Embed Reports on Social Media: Google Data Studio helps you share your reports on popular social media sites such as Twitter and Facebook. It is effortless to share your reports. You simply click “Embed this report” on the platform and paste the given URL to your social media post.

Key Features of Google Data Studio
Google Data Studio is one of many data visualization tools online. This section will look at what makes it this special and how it separates itself from the other data visualization products.
Customization Control
The Data Studio gives you the chance to add pages, tables, and charts whenever you need them. You can customize your dashboard with any color you like, such as your company colors.
There are prepared themes you can choose from in the theme gallery. If none of those themes look the way you want them, you can create a custom theme based on your preferences without ease. GDS even gives you the option to extract a custom theme from an image of your choice.
You can edit your general layout from your page size to page alignment and all those basic but effective layout settings. You cannot only edit your page layout but also use various charts and visuals to work with, as Google Data Studio gives you a wide variety of them.
Here is a related blog article: How to Advertise on Google
Interactive Dashboard
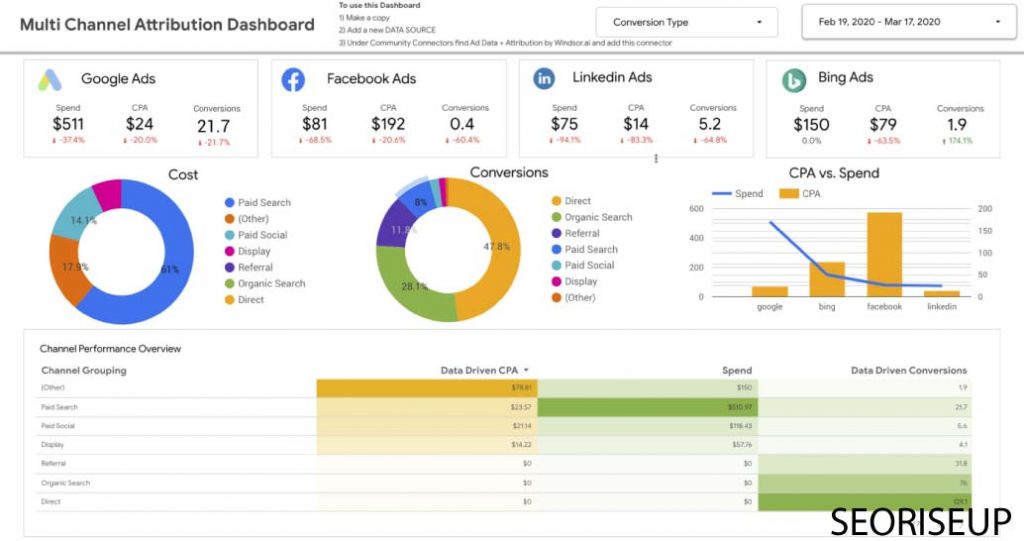
An interactive interface is always better than one that is not! Data Studio allows you to visually display your key metrics and interact with all your data, which helps you get important information from your dashboard and make healthy business decisions.
The dashboard can easily filter the big data you’re working on. It can do it on chart, page, and report level filters to delete all the data you won’t need. The dashboard can also be more flexible with optional metrics adding. Also, for charts with different dimensions available, you can use Drill Down and Drill Up options to use a single chart for multiple dimensions.
Data Sources and Connectors
Google Data Studio is a fantastic tool for visualizing the data you get from all the Google platforms you are using. They give you access to seventeen free connectors such as Google Search Console, Google Ads, Analytics, and much more. You can use many other partner connectors to use big connectors like Facebook Ads. All those options will give you the data you need with various data ranges.
It helps you out when you add a new data source by letting you configure the new data source’s fields. You can edit their types, names or even add more calculated fields. This means you can even customize the data flowing to your report from the chosen data sources.

Frequently Asked Questions on Google Data Studio
What are Data Controls in Google Data Studio?
Data Controls is a feature of Google Data Studio that lets you make a dashboard template that dynamically displays data chosen by the user with just one click. The feature has a wide range of benefits such that it can help you analyze your data with one click instead of a multiple-stage of copying a report and connecting your data to it.
Does Google Data Studio cost money?
At the moment, it is free for all users. No matter how big your company is, the service is entirely free to use. You may think that because the service is free, it might be of lower quality when it’s compared to other paid products. But this is not the case. Google Data Studio has many benefits and key features that make it as feasible as its paid alternatives. The article can help you on exploring the platform’s excellent features. Have a look!
Does Google Data Studio refresh automatically?
Google Data Studios pull the data from Google’s connectors, various partners, and the community. Most connectors support the live connection feature, which helps you get the data you want in real-time. A real-time data connection means that the information is pulled every time you open up your dashboard or load a report.
How do you set a data range in the Data Studio?
The data source sets the default data range. You can change the data amount that is shown by setting your “Default Data Range” property. You can change that property for the entirety of your report or a specific part.
How many data sources can I blend in Google Data Studio?
In a single chart, you can edit and blend up to five data sources. You can add a data source by clicking “Add Another Data Source” in an empty data source panel.
Data Studio in Short
Google Data Studio is an excellent option for those looking to visualize their activities’ data. It’s free and competent with many benefits and key features that separate it from the other free and paid options. You can customize and edit nearly every aspect of your reports and dashboard to get the data you want the way you want! It’s worth giving a shot whether you own a big company or a small start-up. Feel free to read the article to get the basics of it. It will provide you an excellent headstart.
If you liked this article, please check out our other SEO-related articles, such as: What Are SEO Tools?


